Development of Smart Cloud-based Irrigation Controller: Real-time Evapotranspiration Monitoring in Tomato Greenhouse

The smart irrigation controller is a controller that reduces water use by monitoring and utilizing site environmental information and applying the right amount of water. These controllers receive feedback from the irrigated system and adjust irrigation duration and/or frequency accordingly. There are generally two types of smart controllers: climatologically based and soil moisture-based. Climatologically based … Read more

Development of Real-time Change Point Analysis for Field Environmental Information in Agriculture

Prehension and evaluation of field environmental conditions are very important tasks in agriculture. To enhance the agricultural production system, an agricultural information supporting system ”Agri-eye” has been developed based on a cloud computing scheme. It consists of work recording, actuation and field environmental monitoring system. Regarding the environmental observation, monitoring nodes have been installed in … Read more

Penerapan Teknologi Inovatif dalam Industri Kelapa Sawit Ramah Lingkungan

Berawal dari share link mengenai seminar sawit yang diselenggarakan oleh jurusan teknik pertanian dan biosystem ugm di wall facebook, ada teman yang menanyakan terkait tema dari seminar, adapun tema yang diangkat pada seminar kali ini adalah “Penerapan Teknologi Inovatif dalam Industri Kelapa Sawit Ramah Lingkungan”, dan pertanyaan yang dilontarkan adalah apa sih teknologi ramahlingkungan yang di tawarkan?

Read more

Pre-research Mobile Web Actuator based on Android

[dropcap]M[/dropcap]y research will focus on mobile actuator based on android mobile, after discuss  and looking for problem met in filed. Mobile web application will doing control and actuator for strawberry greenhouse.

This is first try, developing application using android sdk.

Read more

Lecture note Biostatistic #4: Probability

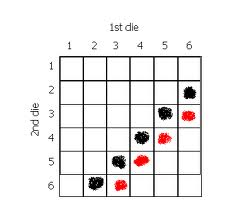
This is my fourth lecture notes about biostatistic, the previous notes, told us about the data presentation ( graphs, polygon, bar chart, histogram and etc. Probability topic will discuss about what happen when we roll a die or tossing a coin, in my opinion this topic will use to help us when we estimate the real distribution in population using several sample. the professor said that this topic is useful to expect the probability when we doing research in large population and doesn’t know about the real population distribution.

Read more

Lecture Note: Presenting Data, tables, graph, summary

This morning is the 3rd meeting in this class, the material is more specific in how to process our data and the objective is we can understand about the whole general future of data.  After we knew about many type of data, the next step is make analysis using tables, graph and summary.

Tables

Tables show the frequency distribution, for nominal and ordinal data, a frequency distribution consist of a set od classes or categories along with numerical counts. If we using tables for our data presentation it will help us to show either summary or details data. the aims of summary data is showing numerical data and dont’ forget to show the number of samples examines, not only presenting the ration but also number of samples.

Read more