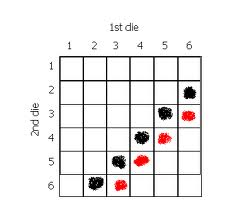
This is my fourth lecture notes about biostatistic, the previous notes, told us about the data presentation ( graphs, polygon, bar chart, histogram and etc. Probability topic will discuss about what happen when we roll a die or tossing a coin, in my opinion this topic will use to help us when we estimate the real distribution in population using several sample. the professor said that this topic is useful to expect the probability when we doing research in large population and doesn’t know about the real population distribution.
 andrew
Lecture Note: Presenting Data, tables, graph, summary
This morning is the 3rd meeting in this class, the material is more specific in how to process our data and the objective is we can understand about the whole general future of data. After we knew about many type of data, the next step is make analysis using tables, graph and summary.
Tables
Tables show the frequency distribution, for nominal and ordinal data, a frequency distribution consist of a set od classes or categories along with numerical counts. If we using tables for our data presentation it will help us to show either summary or details data. the aims of summary data is showing numerical data and dont’ forget to show the number of samples examines, not only presenting the ration but also number of samples.
Lecture note: Biostatistic #2: Types of Data
This is lecture note for 2nd meeting, Tuesday, Oct 12th 2011. Today we study about Biostatistics and techniques in this kind of knowledge. like the previous post, statistic is the activity involving obtain data, analyze data, and present data.
Statistic is the summary of information (data) in a meaningful fashion, and its appropriate presentation.
Statistic is the population if a plausible model explaining the mechanism that generates the data, with the ultimate goal to extrapolate and predict data under circumstance beyond the current experiment.
Biostatistic is the segment of statistic that deals with data arising from biological process or medical experiments
We start to know about descriptive statistic, the professor said that this is the point in descriptive statistic
- A means of organizing and summarizing observations
- They provide us with an overview of the general futures of data, this point like the quotes above ( predict and forecast).
- Tables, graphs, and numerical summary measures. Tables and graph is uses for make us easy to understand about the summary that we made.
lecture note: Fundamental of Agricultural Sciences: Biostatistic

This lecture was delivered by Prof. Keiji Takasu form Agri-Bio Research Laboratory. This class will provide lecture about biostatistic, in my first impression, biostatistic is field of statistic which it applied in sciences to solve the problem in real. Actually I prepare also if professor asking me about this one, but i don’t have guts enough for cheer up :D, so that i write down in this lecture note.
Looking for my first classroom…
This is my first time to attend in this international class, as i know the location is 21 century plaza room no.1. I asking to my friends in laboratory, he doesn’t know about the place, so that we immediately looking at campus map, and find building related to places. I found the location, named 21 … Read more
Hajimemashite..
#introduction Great moment and opportunity to me to study about IT-Agriculture with Professor in Japan, I was contact with him since Feb 25th 2009. Now iam in this laboratory, Biproduction Engineering Laboratory, and I will do the best I can for pursuing my study here. I using this blog for my daily log book. Hopefully … Read more


